About this guide
This guide describes the two interfaces of the HealthDati platform, Train a model and Assess risk, as they appear in platform revision 494a2c53 of 1 October 2026. It explains what each value means, how to read the measures and what a message asks of you. The tutorial shows how to run a training or an assessment for the first time, step by step.
The HealthDati platform is not intended for clinical decisions. The figures in this guide show the interfaces in demo mode.
How this guide is written:
- Interface labels are shown in bold, exactly as the interface shows them, such as Calculate risk.
- Messages from the interface are shown in quotation marks, such as ‘Could not start: …’. The ellipsis stands for the part the interface fills in for the situation.
- The English interface writes numbers with a decimal point, such as ‘8.2%’.
The interface changes as the platform develops. If this guide describes something differently from what you see, the interface is right; the version of this guide is shown at the top of the page and on the title page of the PDF.
The platform at a glance
The HealthDati platform works by delegated learning: computation happens where the data is, at the clinic node of a participating site. The platform hands the node a job, the node runs it on site and returns only aggregated metrics. Patient data does not leave the site.
There are two interfaces for this, each at its own address:
| Interface | Where it runs | What it is for |
|---|---|---|
| Train a model | centrally, beside the platform | Having a prediction model trained on one clinic's data, and judging the result |
| Assess risk | in a clinic, beside its node | Estimating the risk with a trained model, for a single case or in aggregate for the whole clinic |
Both belong to the project's pilot task, in-hospital mortality (K1): the risk of dying during the hospital stay. You do not switch between the interfaces within one page; each address shows exactly one of them.
Each interface runs either as a demo or connected. The demo needs neither the platform nor a node. When connected, it works with the platform and a clinic node. The next section shows how to tell the difference; the section Demo and connected operation describes what else changes when connected. The architecture page shows how the components fit together technically.
Header and context statements
Both interfaces have the same header.
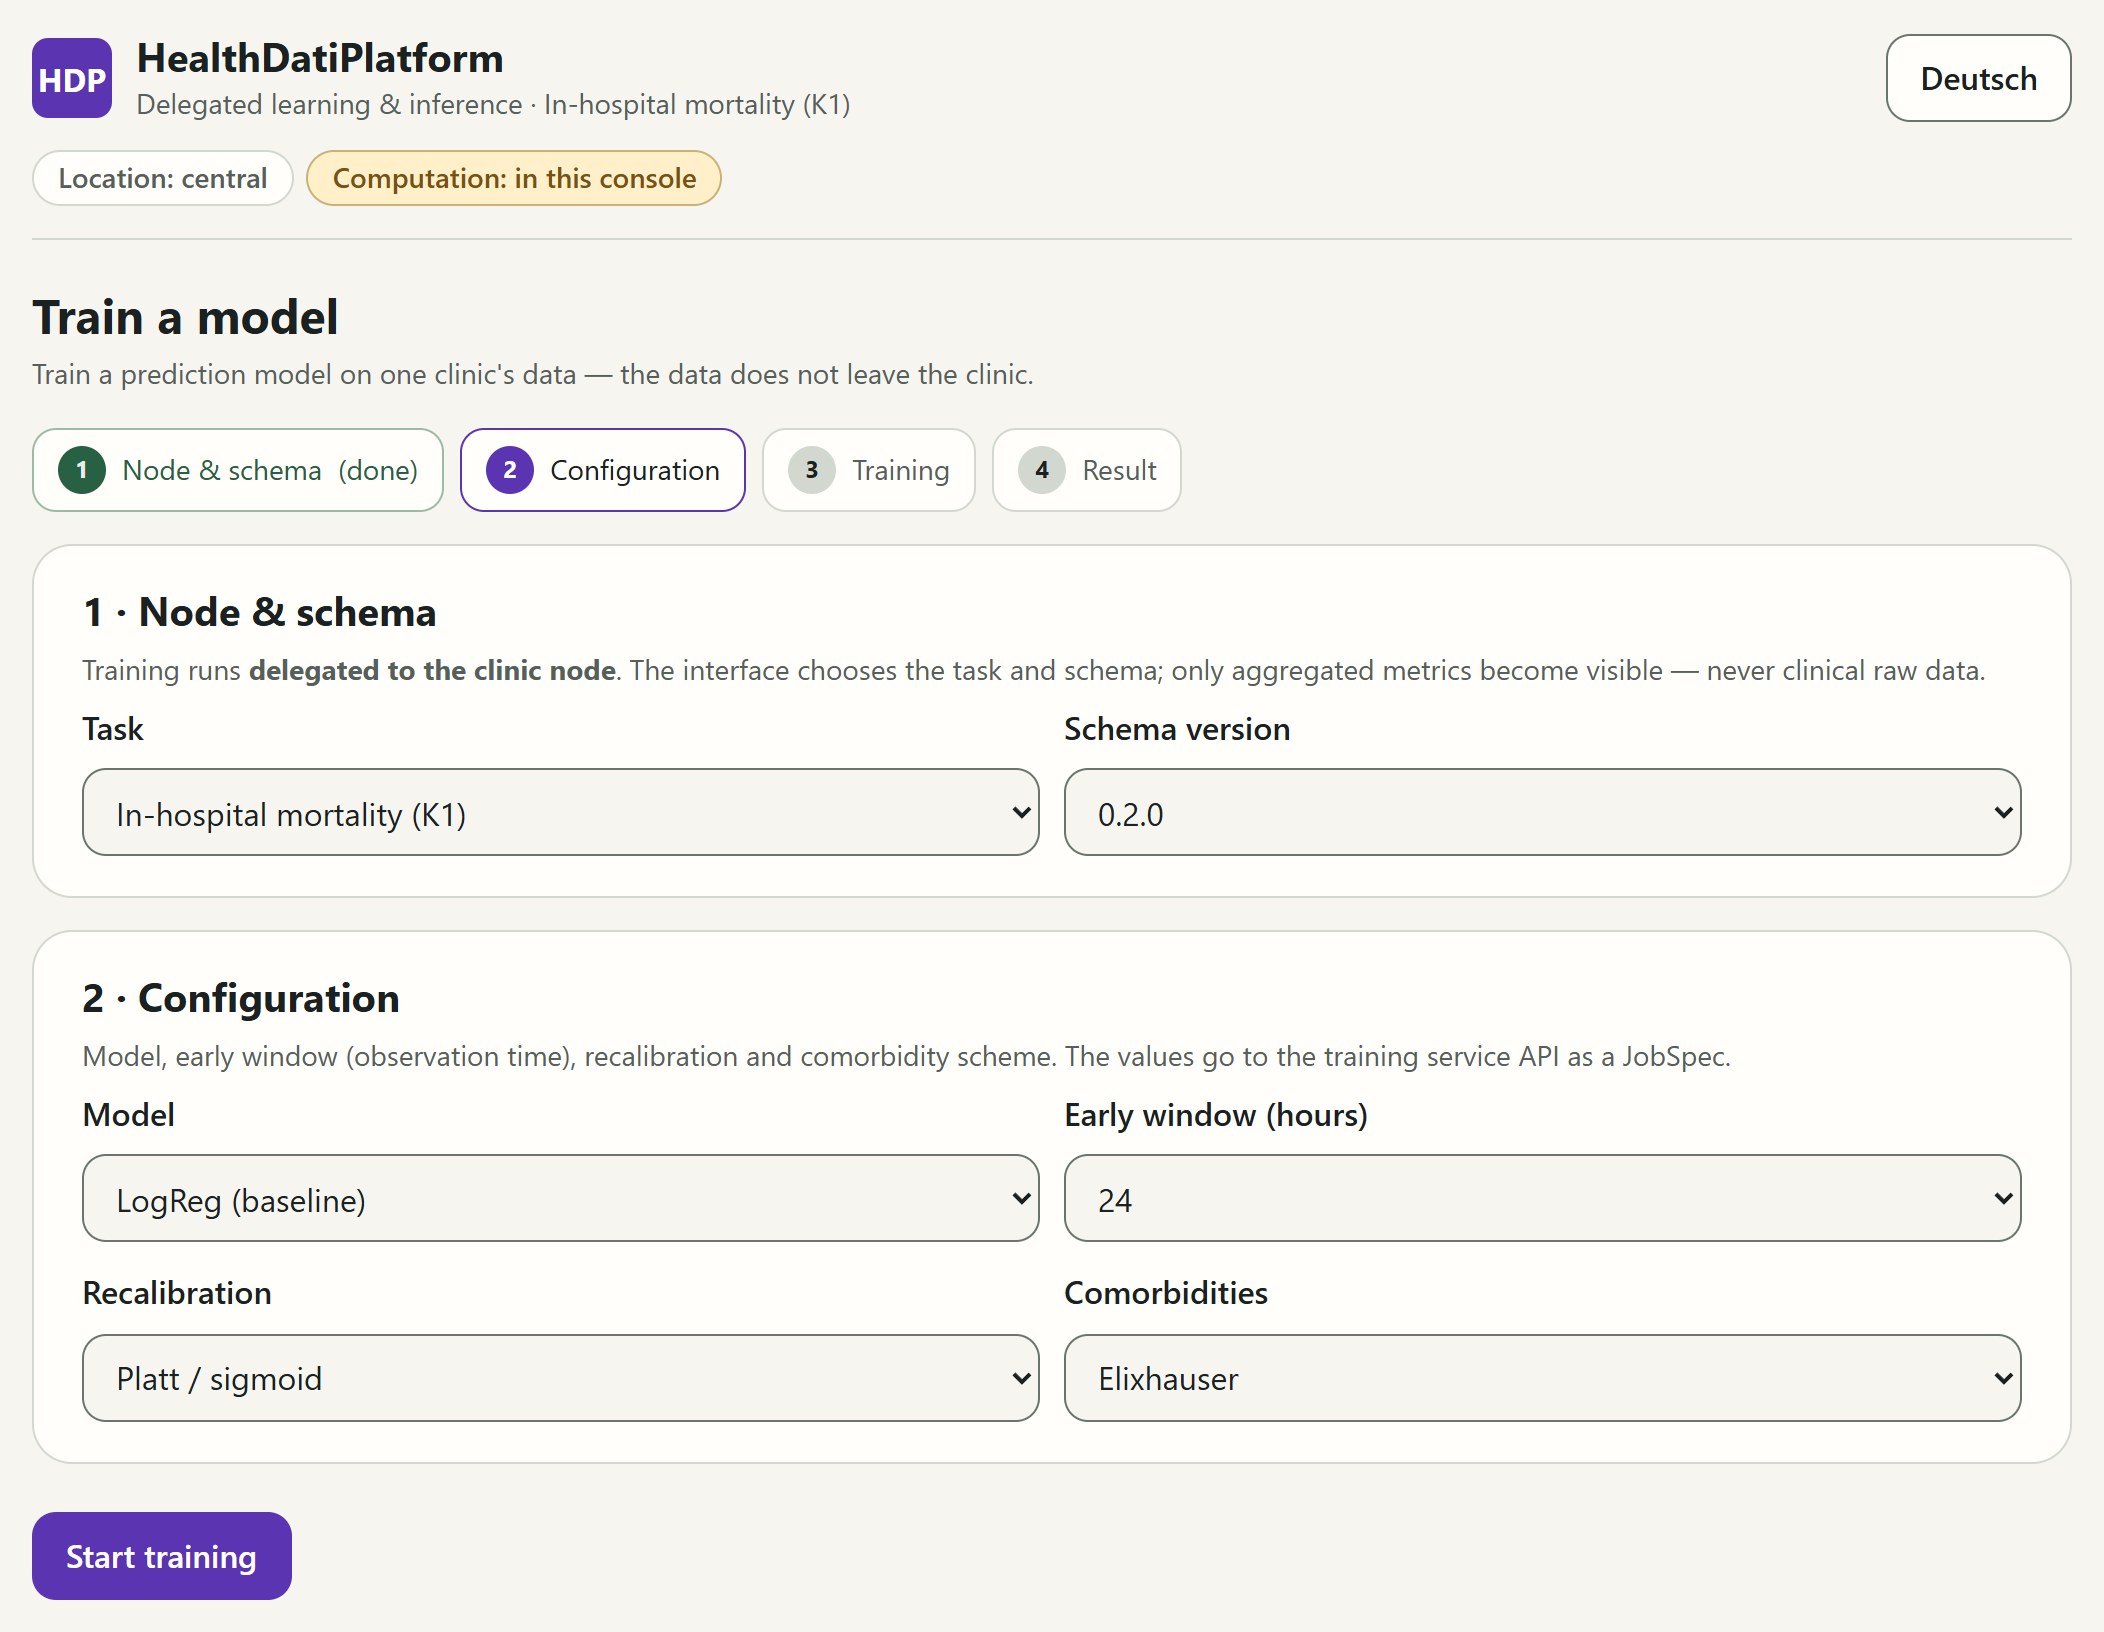
The first row shows the platform's name, its task and, on the right, a button for the language: on an English interface it reads ‘Deutsch’. Before everything else there is a skip link, Skip to content, which appears when you first press the Tab key.
Below it, two statements name the location and the computation. Pointing at one with the mouse shows an explanation.
| Statement | Meaning |
|---|---|
| Location: central | This interface runs centrally, beside the platform. Train a model always shows this. |
| ‘Location: …’ with a clinic's name | This interface runs in the named clinic, beside its node. Assess risk shows this. |
| Location: clinic (unnamed) | As above, but the installation gives no name; so in the demo. |
| Computation: in this console | The interface computes every value itself; no service is connected. So in the demo. |
| Computation: connected services | The values come from connected services of the platform and the node. |
The same two statements appear beside every result, in the copied result text and on printouts. That way it stays clear where a result comes from, even when it is passed on.
Below the header, the interface states its purpose: Train a model or Assess risk, with one sentence of explanation.
When the interface does not load
- ‘Loading the interface…’ and ‘Loading the configuration…’ appear briefly when the page opens. This is normal.
- ‘Could not load the configuration: …’ means that the service behind the interface does not answer. The interface then deliberately shows nothing else. Reload the page later; if the error persists, contact your site's operations team.
- ‘This console has been updated. Reload the page to continue; unsaved input will be lost.’ appears when a new version was installed while you were working. The page never reloads by itself. Note down what you still need, then click Reload.
Training a model
The Train a model interface leads through four steps, shown by a step indicator at the top: Node & schema, Configuration, Training and Result. The current step is highlighted. Completed steps carry ‘(done)’, a failed training ‘(failed)’, a cancelled one ‘(cancelled)’. The first two steps form one form; that is why Node & schema is already done when the page opens.
The settings
The service behind the interface supplies the choices in each field. The first choice is preselected; the defaults suit a first training run.
| Setting | Choices in the demo, default first | Meaning |
|---|---|---|
| Task | In-hospital mortality (K1) | The prediction task. There is currently only this one. |
| Schema version | 0.2.0, 0.1.1, 0.1.0 | The version of the common data model the job's data follows. The node must know it, or the training fails. |
| Model | LogReg (baseline), LogReg L1 (sparse), GBDT | The method: a logistic regression, a variant of it that makes do with fewer features, or a method built from many small decision trees (gradient boosting). |
| Early window (hours) | 24, 48 | How many hours after admission the model may take values from. |
| Recalibration | Platt / sigmoid, Isotonic, none | How the model's risk values are adjusted to the observed rates after training. |
| Comorbidities | Elixhauser, Charlson, both | Which scheme groups comorbidities into features. |
Below the form, the interface states what it computes with; when connected, for example, ‘Connected to … — only aggregated metrics are shown; clinical raw data does not leave the node.’
Start training submits the job. While it is being sent, the button reads ‘Starting…’ and the fields are locked. If the platform refuses the job, ‘Could not start: …’ appears with the reason; the section Messages explains the reasons.
Progress
After the start, the interface shows the job under the heading ‘Training running — …’ with its id. The heading stays, even after a cancellation or failure.
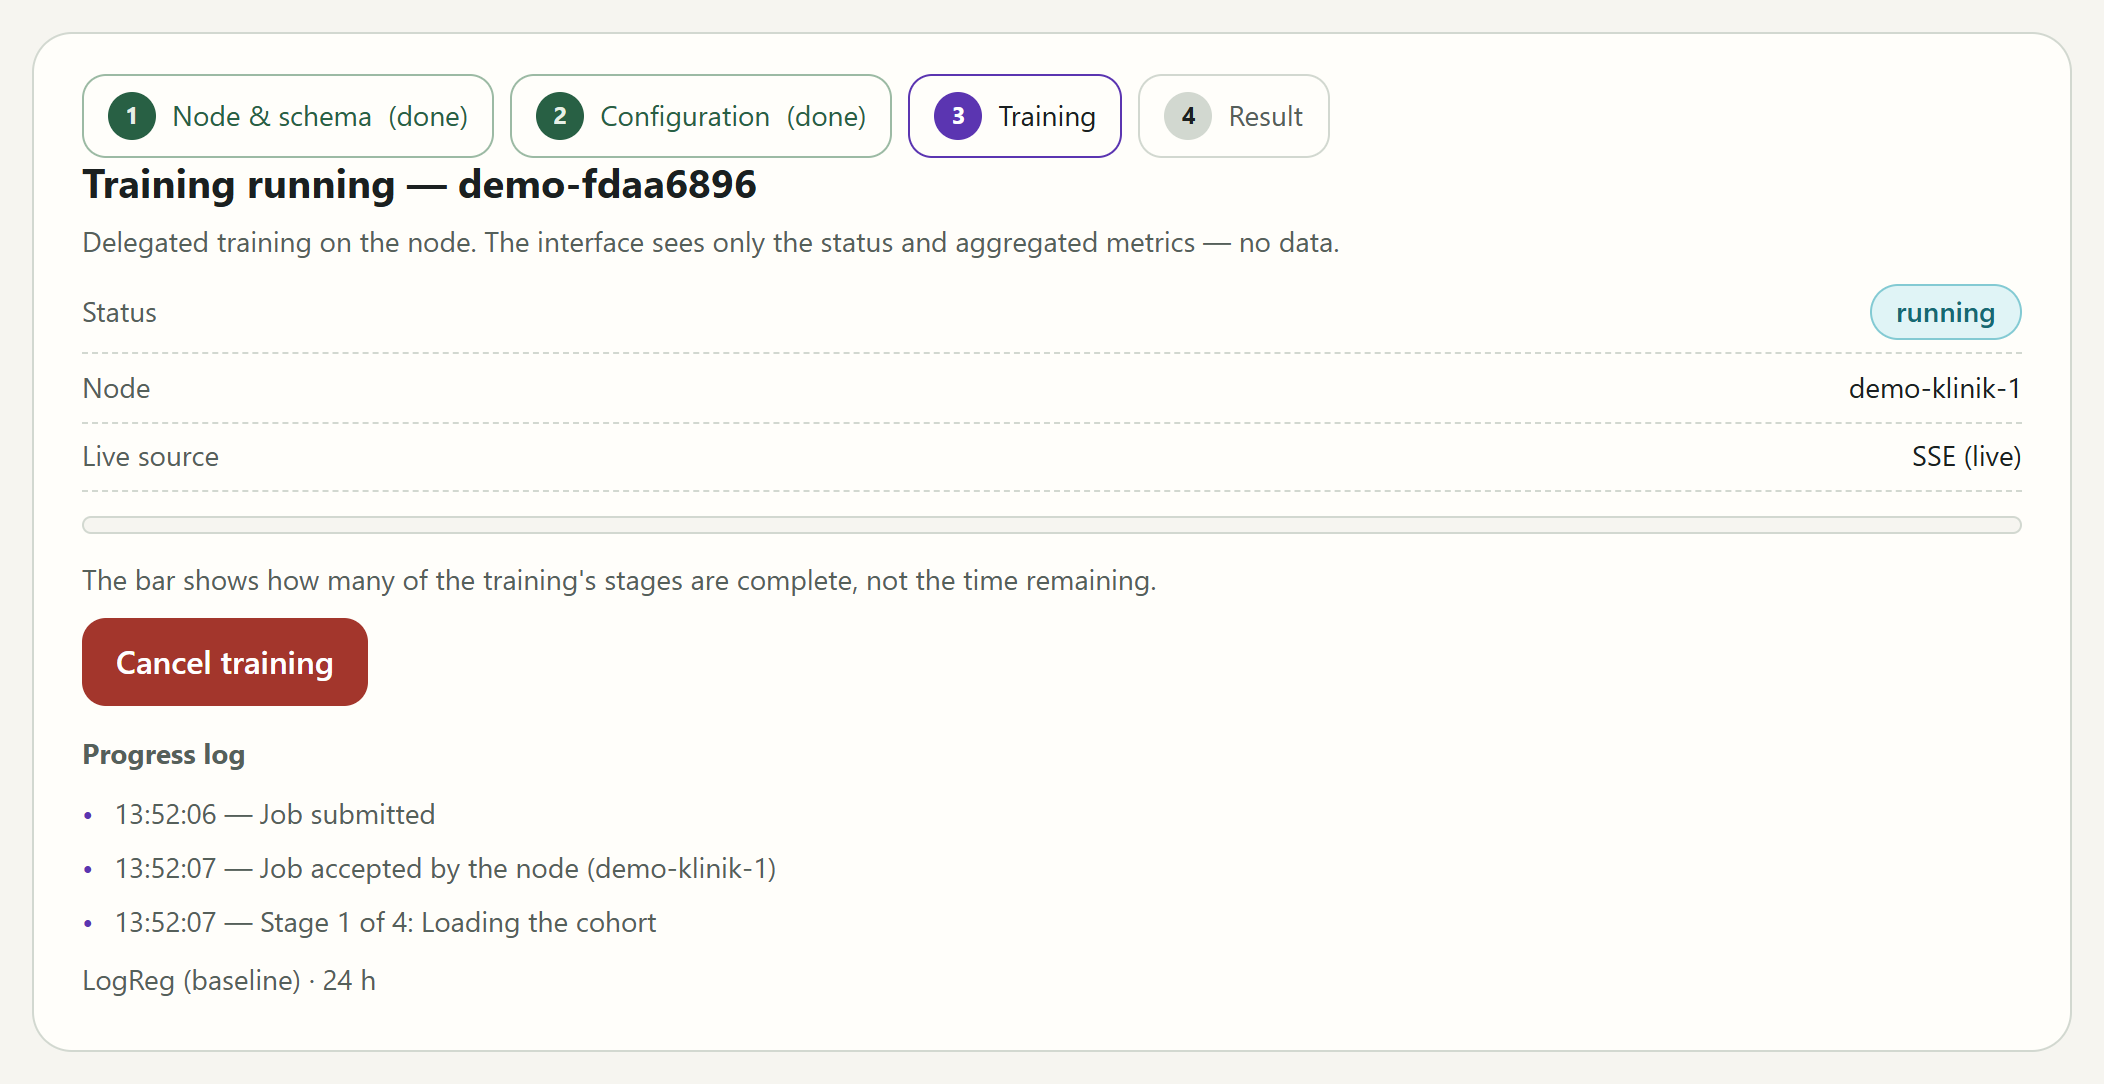
The status says where the job stands:
| Status | Meaning |
|---|---|
| submitted | The platform has accepted the job; it is waiting for a node. |
| accepted | A clinic node has taken the job. |
| running | The node is computing. |
| completed | The result is ready. The interface switches to the result by itself. |
| failed | The job ended without a result. The interface gives the reason below. |
| cancelled | The job was ended on request. |
Beside it:
- Node: the id of the clinic node running the job,
demo-klinik-1in the demo. Until a node takes the job, it shows ‘—’. - Live source: how the interface learns about changes. With ‘SSE (live)’, the service reports every change at once. With ‘Polling (SSE fallback)’ or ‘Polling (SSE unavailable)’, the interface asks at short intervals, because the live connection is disrupted or unavailable. You see the same progress, only slightly later; it is not an error.
- The progress bar shows how many of the training's four stages are complete, in steps of 25%. Before the first stage it is empty and shows no value. It says nothing about the time remaining.
- The Progress log lists, with the time, what happens at the node: ‘Job submitted’, ‘Job accepted by the node’ with the node's id, then the four stages ‘Stage 1 of 4: Loading the cohort’, ‘Fitting the model’, ‘Calibrating the model’ and ‘Computing the metrics’, and finally ‘Result ready (aggregates only)’. Aggregates only means that only aggregated metrics come back.
- Below the log, the job's model and early window are shown, such as ‘LogReg (baseline) · 24 h’.
In the demo, a training run takes about six seconds.
Cancellation and failure
Cancel training does not end a training run at once; it requests the cancellation. The button then reads ‘Cancellation requested…’, and the interface explains: ‘Cancellation requested. The node stops at the next stage boundary; the current stage still finishes.’
- When the node stops, the status changes to cancelled.
- If the training finishes before the cancellation can take effect, for example during the last stage, the interface says ‘The job finished before the cancellation could take effect.’ It then does not switch to the result by itself; Show result opens it.
- After a cancellation or failure, New training run takes you back to the settings.
If a training run fails, Training failed appears below the status, and below that the reason, often with a support ID, such as ‘(Support ID: …)’. Note the support ID when you ask the operations team for help: it lets them find the event in the logs. The possible reasons are listed in the section Messages.
The training result
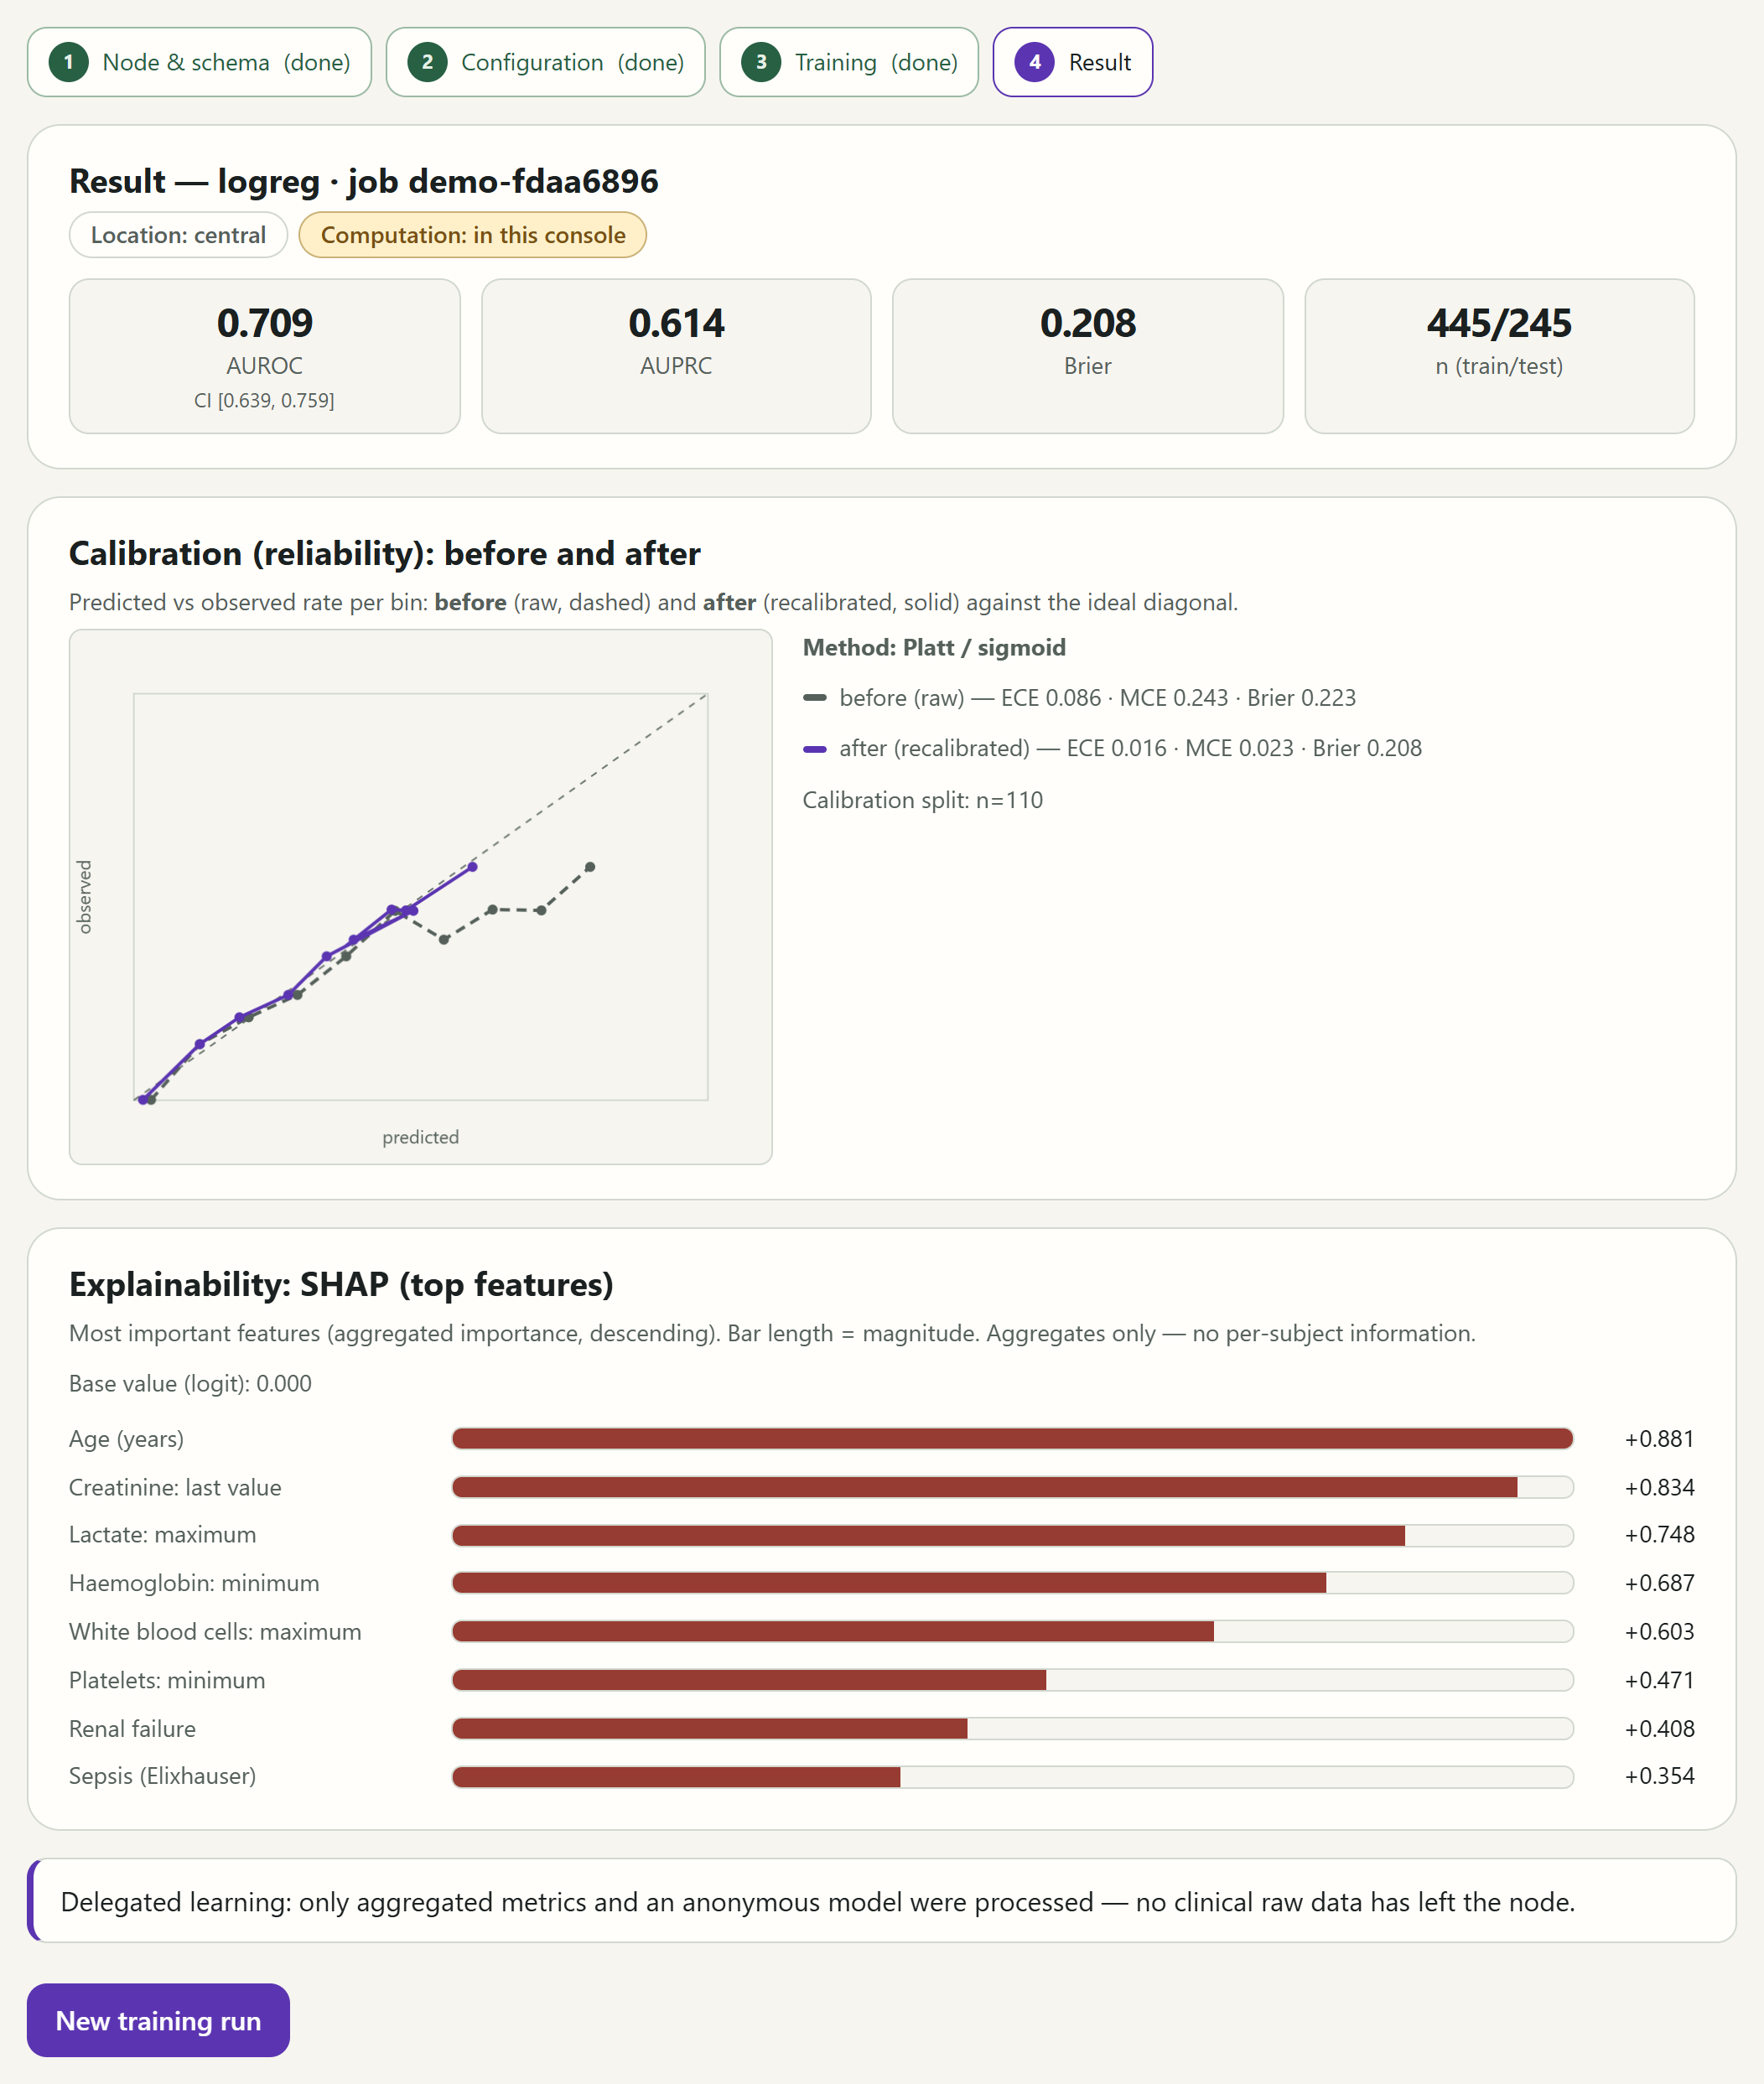
When the training is complete, the interface shows the Result. The heading names the model by its technical id, that is ‘logreg’, ‘logreg_l1’ or ‘gbdt’ rather than the name in the form, and the job's id. The two context statements follow.
The measures
The four measures at the top describe how well the model performs on test cases that were not used for training. The interface shows them with three decimal places; their meaning is given here and in the section Measures at a glance.
- AUROC: how well the model separates cases with and without the event. 0.5 corresponds to chance, 1 to perfect separation. Below it is the confidence interval, such as ‘CI [0.656, 0.776]’: the range in which the true value very likely lies. The fewer the test cases, the wider it is.
- AUPRC: how well the model finds the rare cases with the event without raising too many false alarms. For rare events it is more informative than the AUROC. Its chance value is not 0.5 but the share of cases with the event.
- Brier: the mean squared difference between the estimated risk and the actual outcome. The smaller, the better.
- n (train/test): how many cases were used for training and testing, such as ‘445/245’.
Instead of a number, suppressed or not available may appear. suppressed means that too few cases lie behind it to show the number without revealing individuals; the interface then says so in a sentence below. not available means that the node did not compute the number. The confidence interval correspondingly reads ‘CI suppressed’ or ‘CI not available’.
Calibration
Calibration (reliability): before and after shows whether the estimated risks match the observed rates. The test cases are grouped by their estimated risk. For each group, the chart plots the mean estimated risk, ‘predicted’, against the share of cases in which the event actually occurred, ‘observed’. A curve on the diagonal means the two agree.
- The dashed curve, ‘before (raw)’, shows the model before recalibration, the solid one, ‘after (recalibrated)’, after it. A good recalibration brings the curve closer to the diagonal.
- The legend names the method, such as ‘Method: Platt / sigmoid’, and gives ECE, MCE and Brier for each curve. If a group is too small, it also says, for example, ‘1 bin suppressed’.
- ‘Calibration split: n=…’ gives the number of cases the recalibration was fitted on.
- Without data, it reads ‘Calibration not available’ or ‘No reliability curve available.’
Explainability
Explainability: SHAP (top features) shows up to eight features that contributed most to the predictions across all cases, in descending order of importance. The length of a bar shows how large the contribution is. The display is aggregated and contains nothing about individual people.
This aggregated importance has no direction: a feature can raise the risk in some cases and lower it in others. That every row here carries a ‘+’ and has the same colour therefore says nothing about the direction. The ‘Base value (logit)’ above the list has no meaning of its own in this view either.
Feature names combine the measurement with its statistic in the early window. ‘Creatinine: last value’, for example, is the last creatinine value measured in the early window; ‘Sepsis (Elixhauser)’ is the comorbidity sepsis in the Elixhauser scheme.
Below the result, the interface confirms: ‘Delegated learning: only aggregated metrics and an anonymous model were processed — no clinical raw data has left the node.’ New training run takes you back to the settings. The training result has no print function of its own; print it from your browser if needed.
Assessing a risk
The Assess risk interface leads through three steps: choose a model and enter patient values, start the evaluation, read the result. You do not choose a clinic: the interface stands in a clinic and names it at the top as its location.
Model and warning threshold
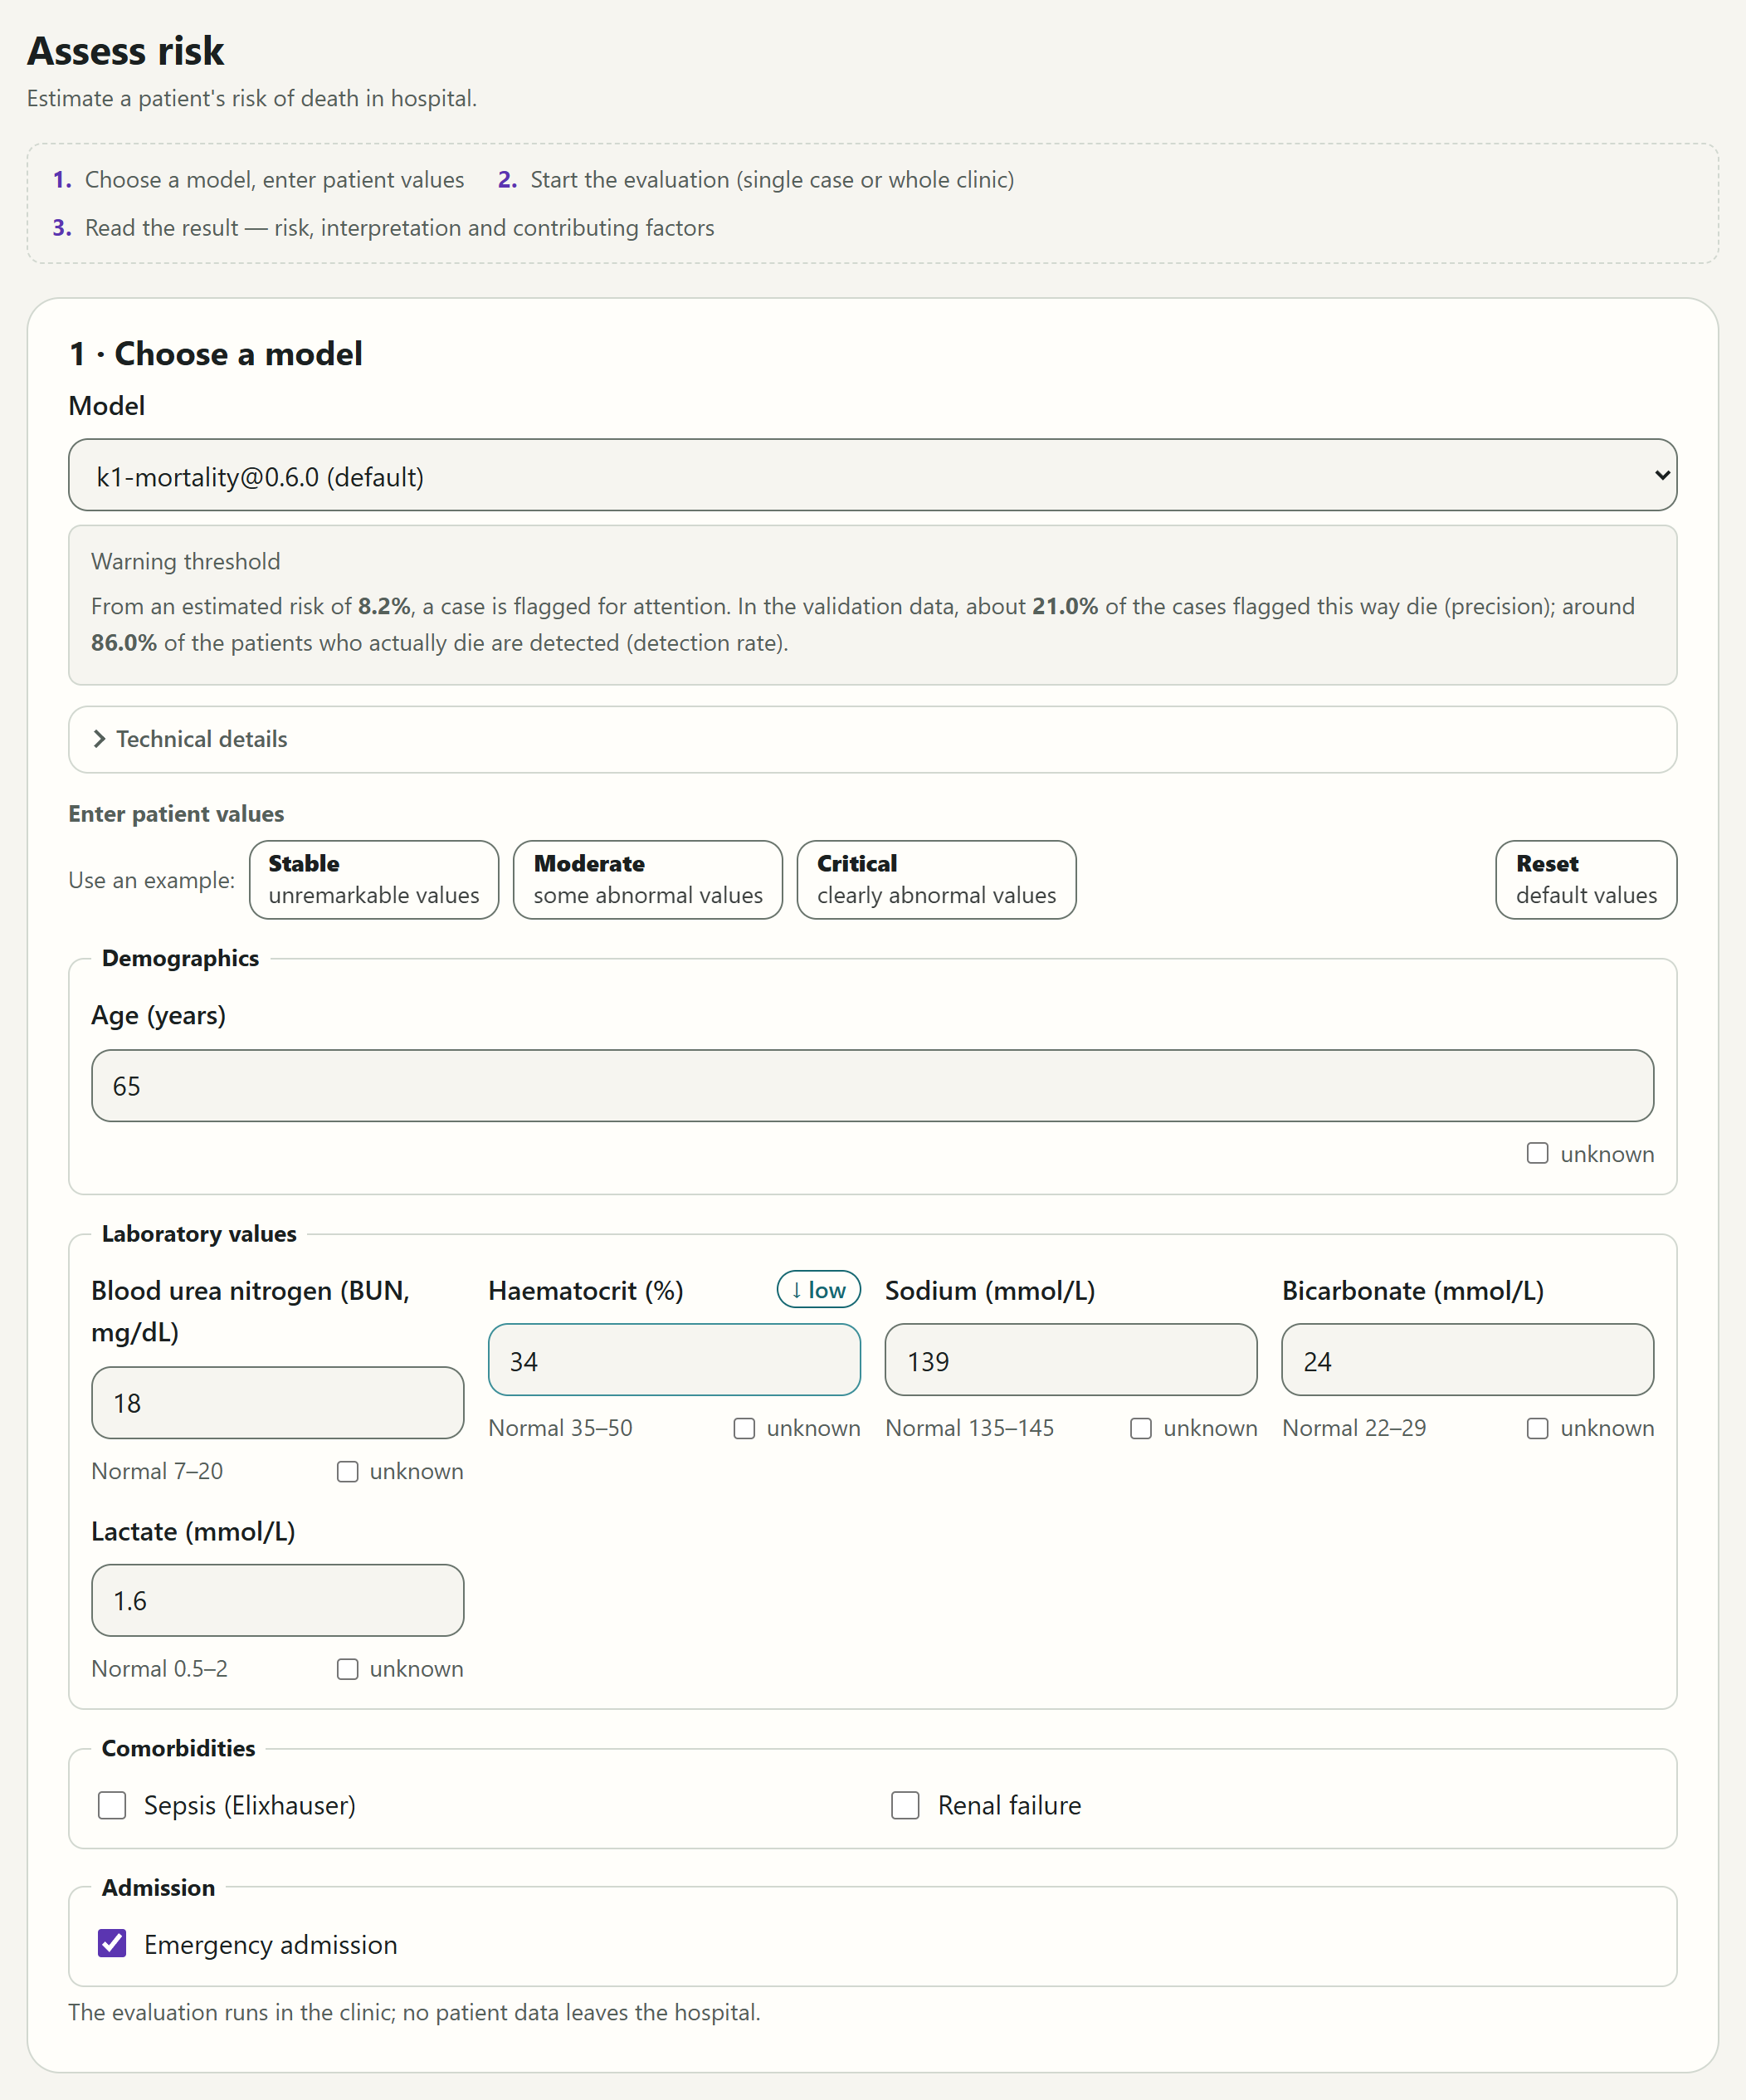
Under Choose a model you choose the model to compute with. The addition ‘(default)’ marks the preselected model. The name gives the model's task and version, such as ‘k1-mortality@0.6.0’.
The Warning threshold box explains when a case is flagged, in the demo like this: ‘From an estimated risk of 8.2%, a case is flagged for attention. In the validation data, about 21.0% of the cases flagged this way die (precision); around 86.0% of the patients who actually die are detected (detection rate).’ The validation is the evaluation of the model on cases whose outcome was known.
Technical details holds information for technically interested readers:
- the model's particulars: the data schema it was trained on, the kind of model, the recalibration, the number of features and the beginning of its fingerprint (sha256), which identifies a model file unambiguously;
- the operating point, such as ‘Operating point (system evaluation · FN:FP=10:1): threshold 8.2% Sensitivity 86.0% PPV 21.0% Specificity 74.0%’. FN:FP=10:1 means that, when the threshold was chosen, a missed death weighed ten times as much as a false alarm.
Patient values
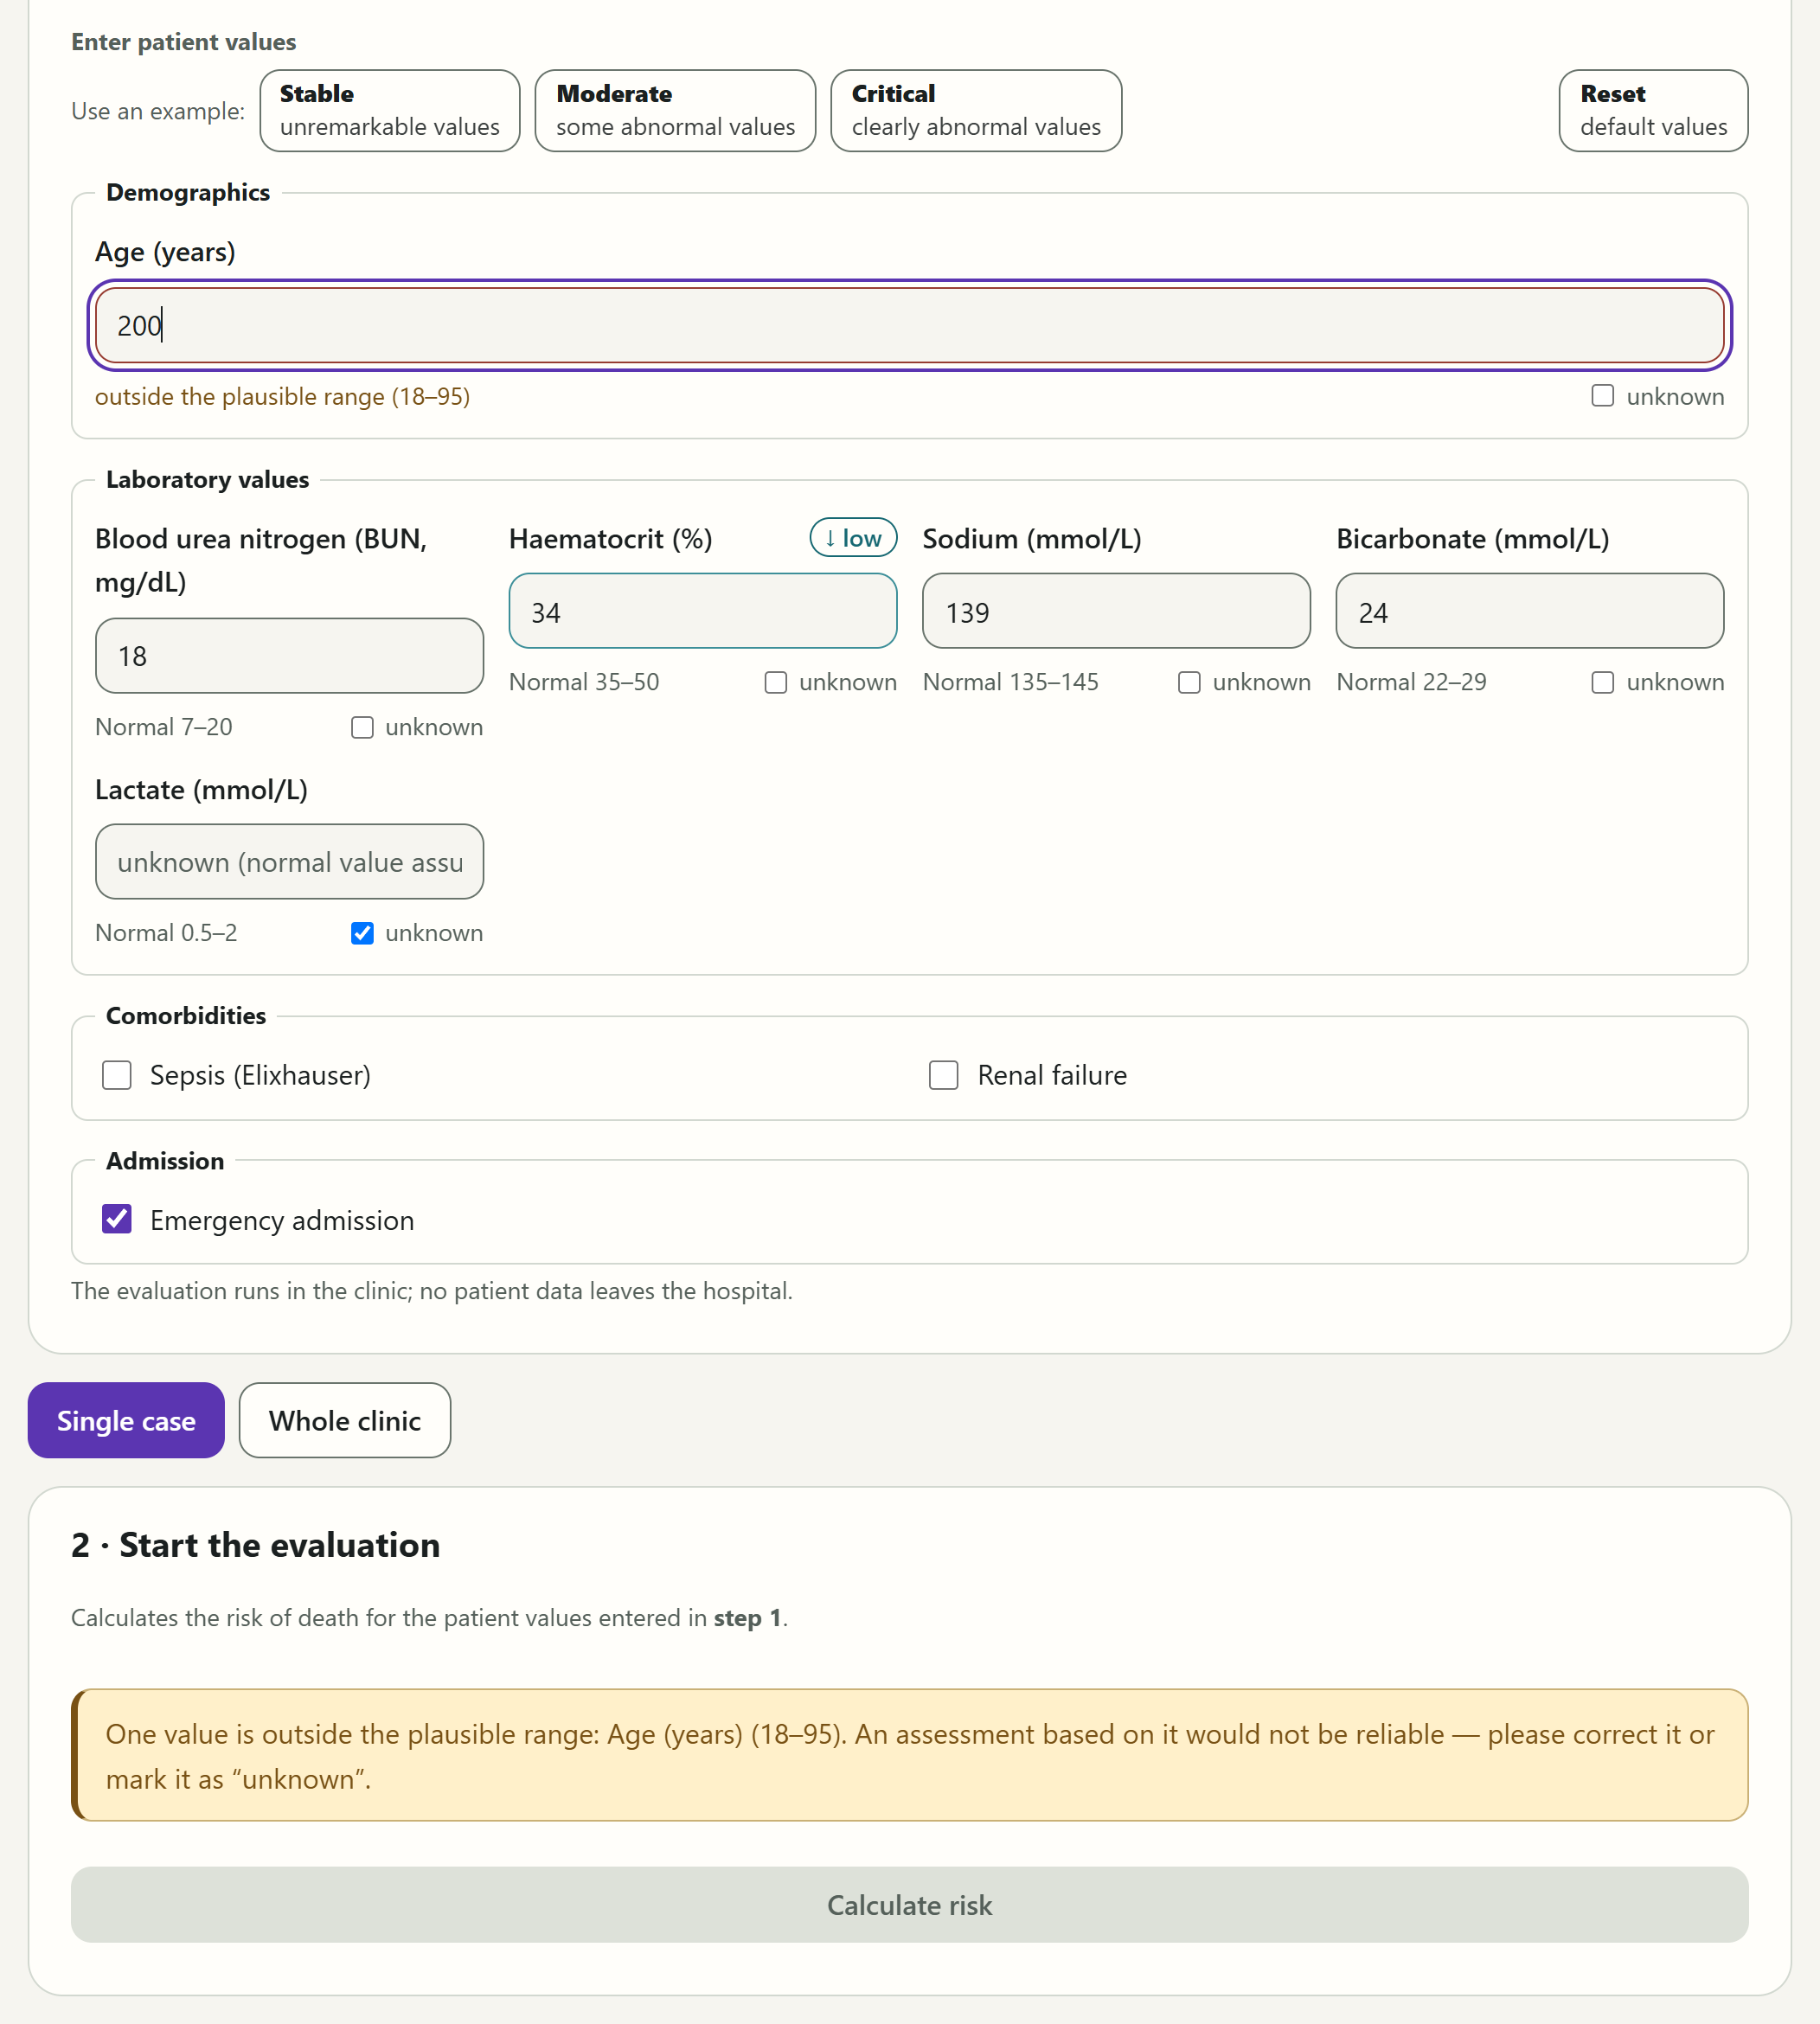
Enter patient values holds the values the model uses, in groups: demographics, laboratory values, comorbidities and admission. The demo model uses nine:
| Value | Plausible range | Default | Reference range |
|---|---|---|---|
| Age (years) | 18–95 | 65 | – |
| Blood urea nitrogen (BUN, mg/dL) | 5–90 | 18 | 7–20 |
| Haematocrit (%) | 18–52 | 34 | 35–50 |
| Sodium (mmol/L) | 120–160 | 139 | 135–145 |
| Bicarbonate (mmol/L) | 8–40 | 24 | 22–29 |
| Lactate (mmol/L) | 0.5–15 | 1.6 | 0.5–2 |
| Sepsis (Elixhauser), Renal failure | yes or no | no | – |
| Emergency admission | yes or no | yes | – |
The defaults are typical values of the demo model, not a description of a person.
- Reference range: below each laboratory value is its reference range, such as ‘Normal 7–20’. If a value lies outside it, the interface marks it ↓ low or ↑ high. This mark is for orientation only; it does not change the computation.
- Plausible range: the interface treats values outside this range as input errors and does not compute with them (see below).
- unknown: if you do not know a numeric value, tick unknown below the field. The field is emptied and shows ‘unknown (normal value assumed)’; the default value is used for the computation. The result then states how many values were unknown. The yes-or-no values have no such option: an empty box means ‘no’.
- Entering numbers: a comma or a point counts as the decimal separator, in both languages. Thousands separators and notations such as ‘1e3’ are not allowed.
Use an example fills every field with one of three example cases: Stable (unremarkable values), Moderate (some abnormal values) or Critical (clearly abnormal values). An example clears every unknown tick. Reset restores the default values and also removes a displayed result.
Input that is not computed
If a value is implausible or not a valid number, the interface does not compute: the reason appears below the field, a message appears above the Calculate risk button, and the button is locked until the value is corrected or marked unknown.
| Below the field | Meaning |
|---|---|
| ‘outside the plausible range (18–95)’ | The value lies outside the range the model knows; an assessment based on it would not be reliable. |
| ‘not a valid number’ | The field is empty or does not contain a number. |
| ‘ambiguous: please enter it without a thousands separator’ | The entry, such as ‘1.600’, could mean either 1.6 or 1600. |
Above the button, the interface sums up which values are affected, such as ‘One value is outside the plausible range: Age (years) (18–95). An assessment based on it would not be reliable — please correct it or mark it as “unknown”.’
Result for a single case
Below the input form, you choose what to evaluate: Single case or Whole clinic. Both areas keep their content when you switch between them. For a single case, click Calculate risk under Start the evaluation. While it calculates, the button reads ‘Calculating…’; afterwards a line below it sums up the result, such as ‘Result: 99.8% · ⚠ Above the warning threshold — flagged for attention’.
A displayed result stays on screen when you then change values, use an example or choose another model. It no longer applies to the values in the form. Click Calculate risk again after every change.
Risk and flag
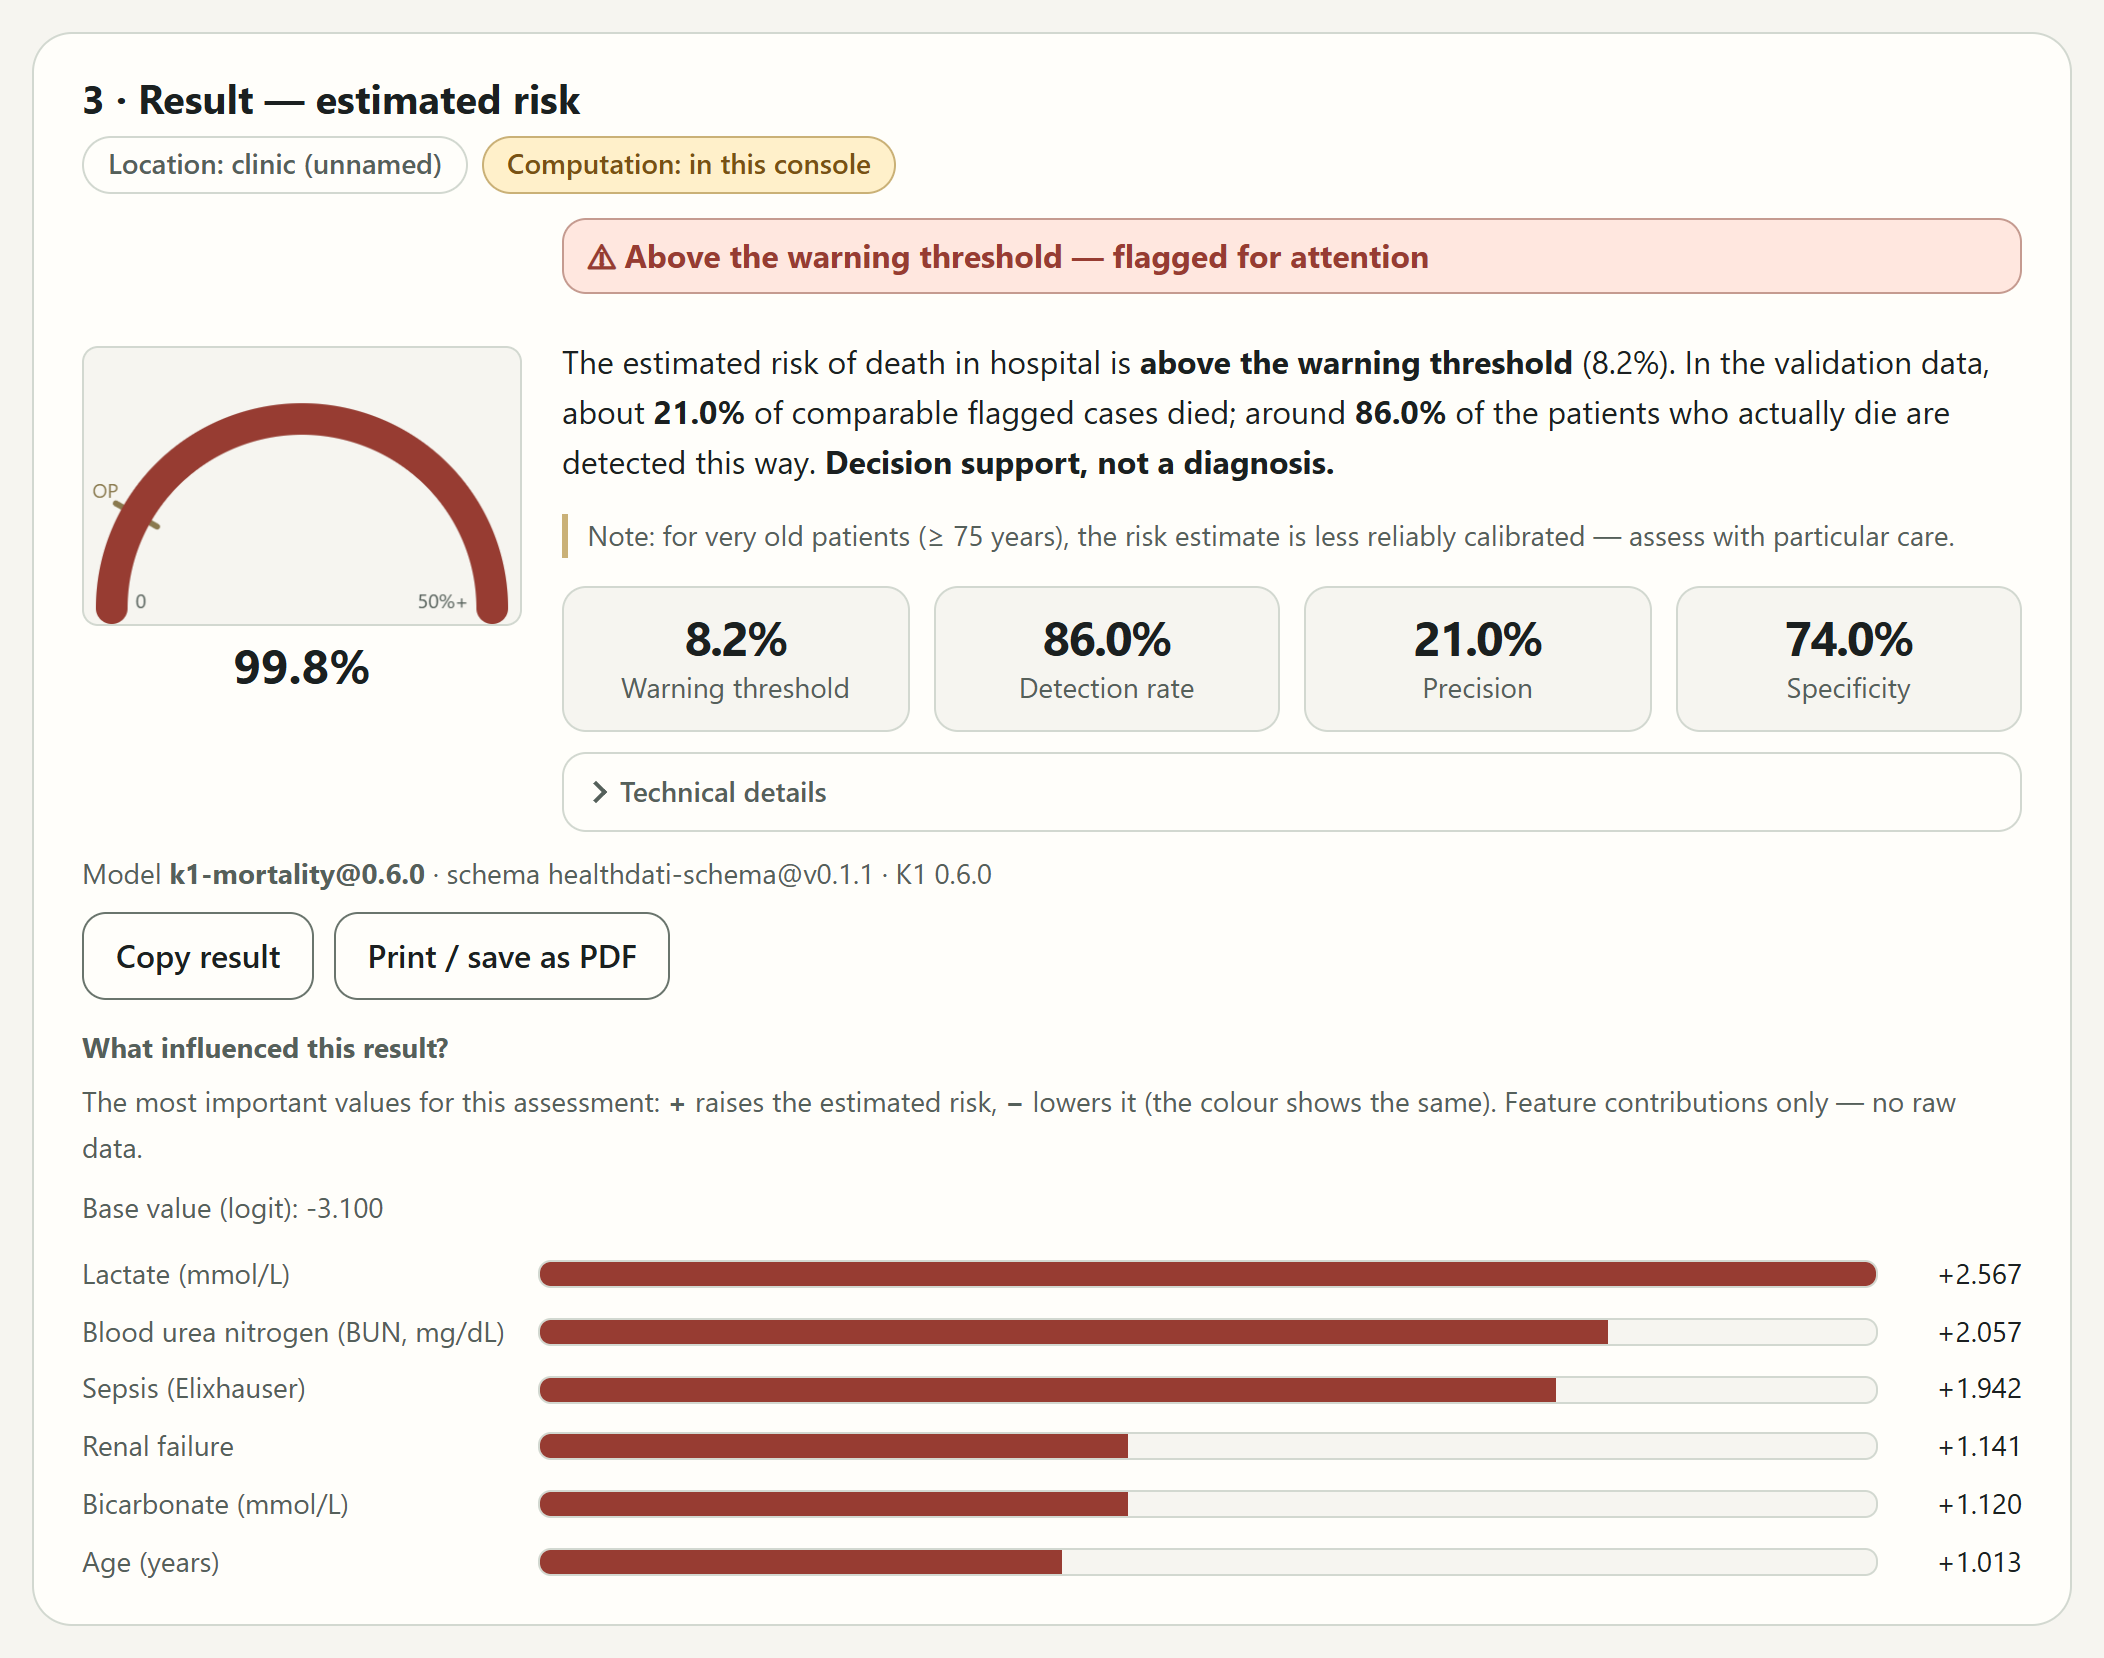
The heading reads ‘3 · Result — estimated risk’; the two context statements follow.
- Semicircle and number: the large value shows the estimated risk, here ‘99.8%’. The semicircle runs from 0 to ‘50%+’; a risk of 50% or more fills it completely. The mark ‘OP’ (operating point) shows the warning threshold.
- Flag: if the risk is at or above the warning threshold, it reads Above the warning threshold — flagged for attention, otherwise Below the warning threshold — not flagged. The second flag is deliberately grey, not green, because not flagged does not mean safe.
- Interpretation: a paragraph places the result in the context of the warning threshold's metrics and ends with ‘Decision support, not a diagnosis.’ Below the threshold, it reminds you that the threshold detects only about 86% of the patients who later die, so a case that is not flagged does not rule out an increased risk.
- Notes: if values were unknown, it says, for example, ‘2 of 9 inputs were unknown; the normal value was used instead, so the assessment is correspondingly less certain.’ Always, whatever age was entered, a note says that the estimate is less reliably calibrated for very old patients, from 75 years.
The warning threshold metrics
Four cards describe how the model behaved at its warning threshold in the validation. Pointing at a card with the mouse shows its definition.
| Card | Meaning | Demo |
|---|---|---|
| Warning threshold | From this estimated risk, a case is flagged for attention. | 8.2% |
| Detection rate | Of the patients who actually die, the share that is flagged (sensitivity). | 86.0% |
| Precision | Share of flagged cases who actually die (PPV). | 21.0% |
| Specificity | Share of survivors who are correctly not flagged. | 74.0% |
These values describe the model and its threshold, not the individual case. A precision of 21% means that in the validation about one in five flagged cases died. The flag directs attention; it does not predict that someone will die.
Technical details gives the model's raw score, ‘Raw score (before Platt)’, and the value after recalibration, ‘Platt-calibrated’, as well as the recalibration and the model's id. The words ‘before Platt’ appear whatever recalibration the model uses.
The line below gives the result's provenance: the model used, the data schema and the version of the task, and when connected also the time, such as ‘Calculated on … · model … · schema … · K1 …’. If the node names no model, it reads ‘Model: not named by the node’.
Contributing factors
What influenced this result? shows the values that mattered most for this assessment, with their contribution:
- A plus raises the estimated risk, a minus lowers it. The colour of the bar shows the same again.
- Contributions are given in logit units, not in percentage points. How far a contribution moves the risk in percent depends on where the case lies anyway.
- The Base value (logit) is the model's starting value before any contribution.
- ‘~ normal value assumed’ marks a value the node filled in itself because it was missing. Values you marked unknown in the form do not carry this mark, because the interface sends the default value for them.
Only contributions are shown, no raw data.
Copying and printing
Copy result puts the result on the clipboard as text, for example for a handover; the button briefly shows Copied ✓. The text contains, line by line:
- the title,
- the two context statements, and when connected also the time of the calculation,
- the model and the inputs, that is how many values were given and how many were unknown,
- the estimated risk, the warning threshold with whether the case lies above or below it, the precision and the detection rate,
- up to six contributing factors with their signs,
- the note on how to read the assessment, as it also appears below the result.
The note on patients aged 75 and over is not part of the copied text. If the browser refuses access to the clipboard, the interface shows the text in a box for you to select and copy yourself.
Print / save as PDF opens the browser's print dialogue, where you can also save as PDF. The printout is always light and contains the header with the two context statements, the Warning threshold box, the risk with its flag, interpretation and notes, the metrics, the provenance line, the contributing factors and the data protection note.
The printout does not contain the patient values entered, nor the semicircle, the technical details or the buttons.
Result for a whole clinic
Under Whole clinic, the platform evaluates every case of one of the clinic's datasets and shows only totals and distributions, never values of individual patients.
Dataset lists the datasets the clinic node has released for such evaluations, in the demo three, ‘Demo A’ to ‘Demo C’. If the node has none, it reads ‘The node has no dataset for cohorts. An operator registers one at the node (node-client dataset register).’ Start cohort inference starts the evaluation; meanwhile the button reads ‘Running…’.
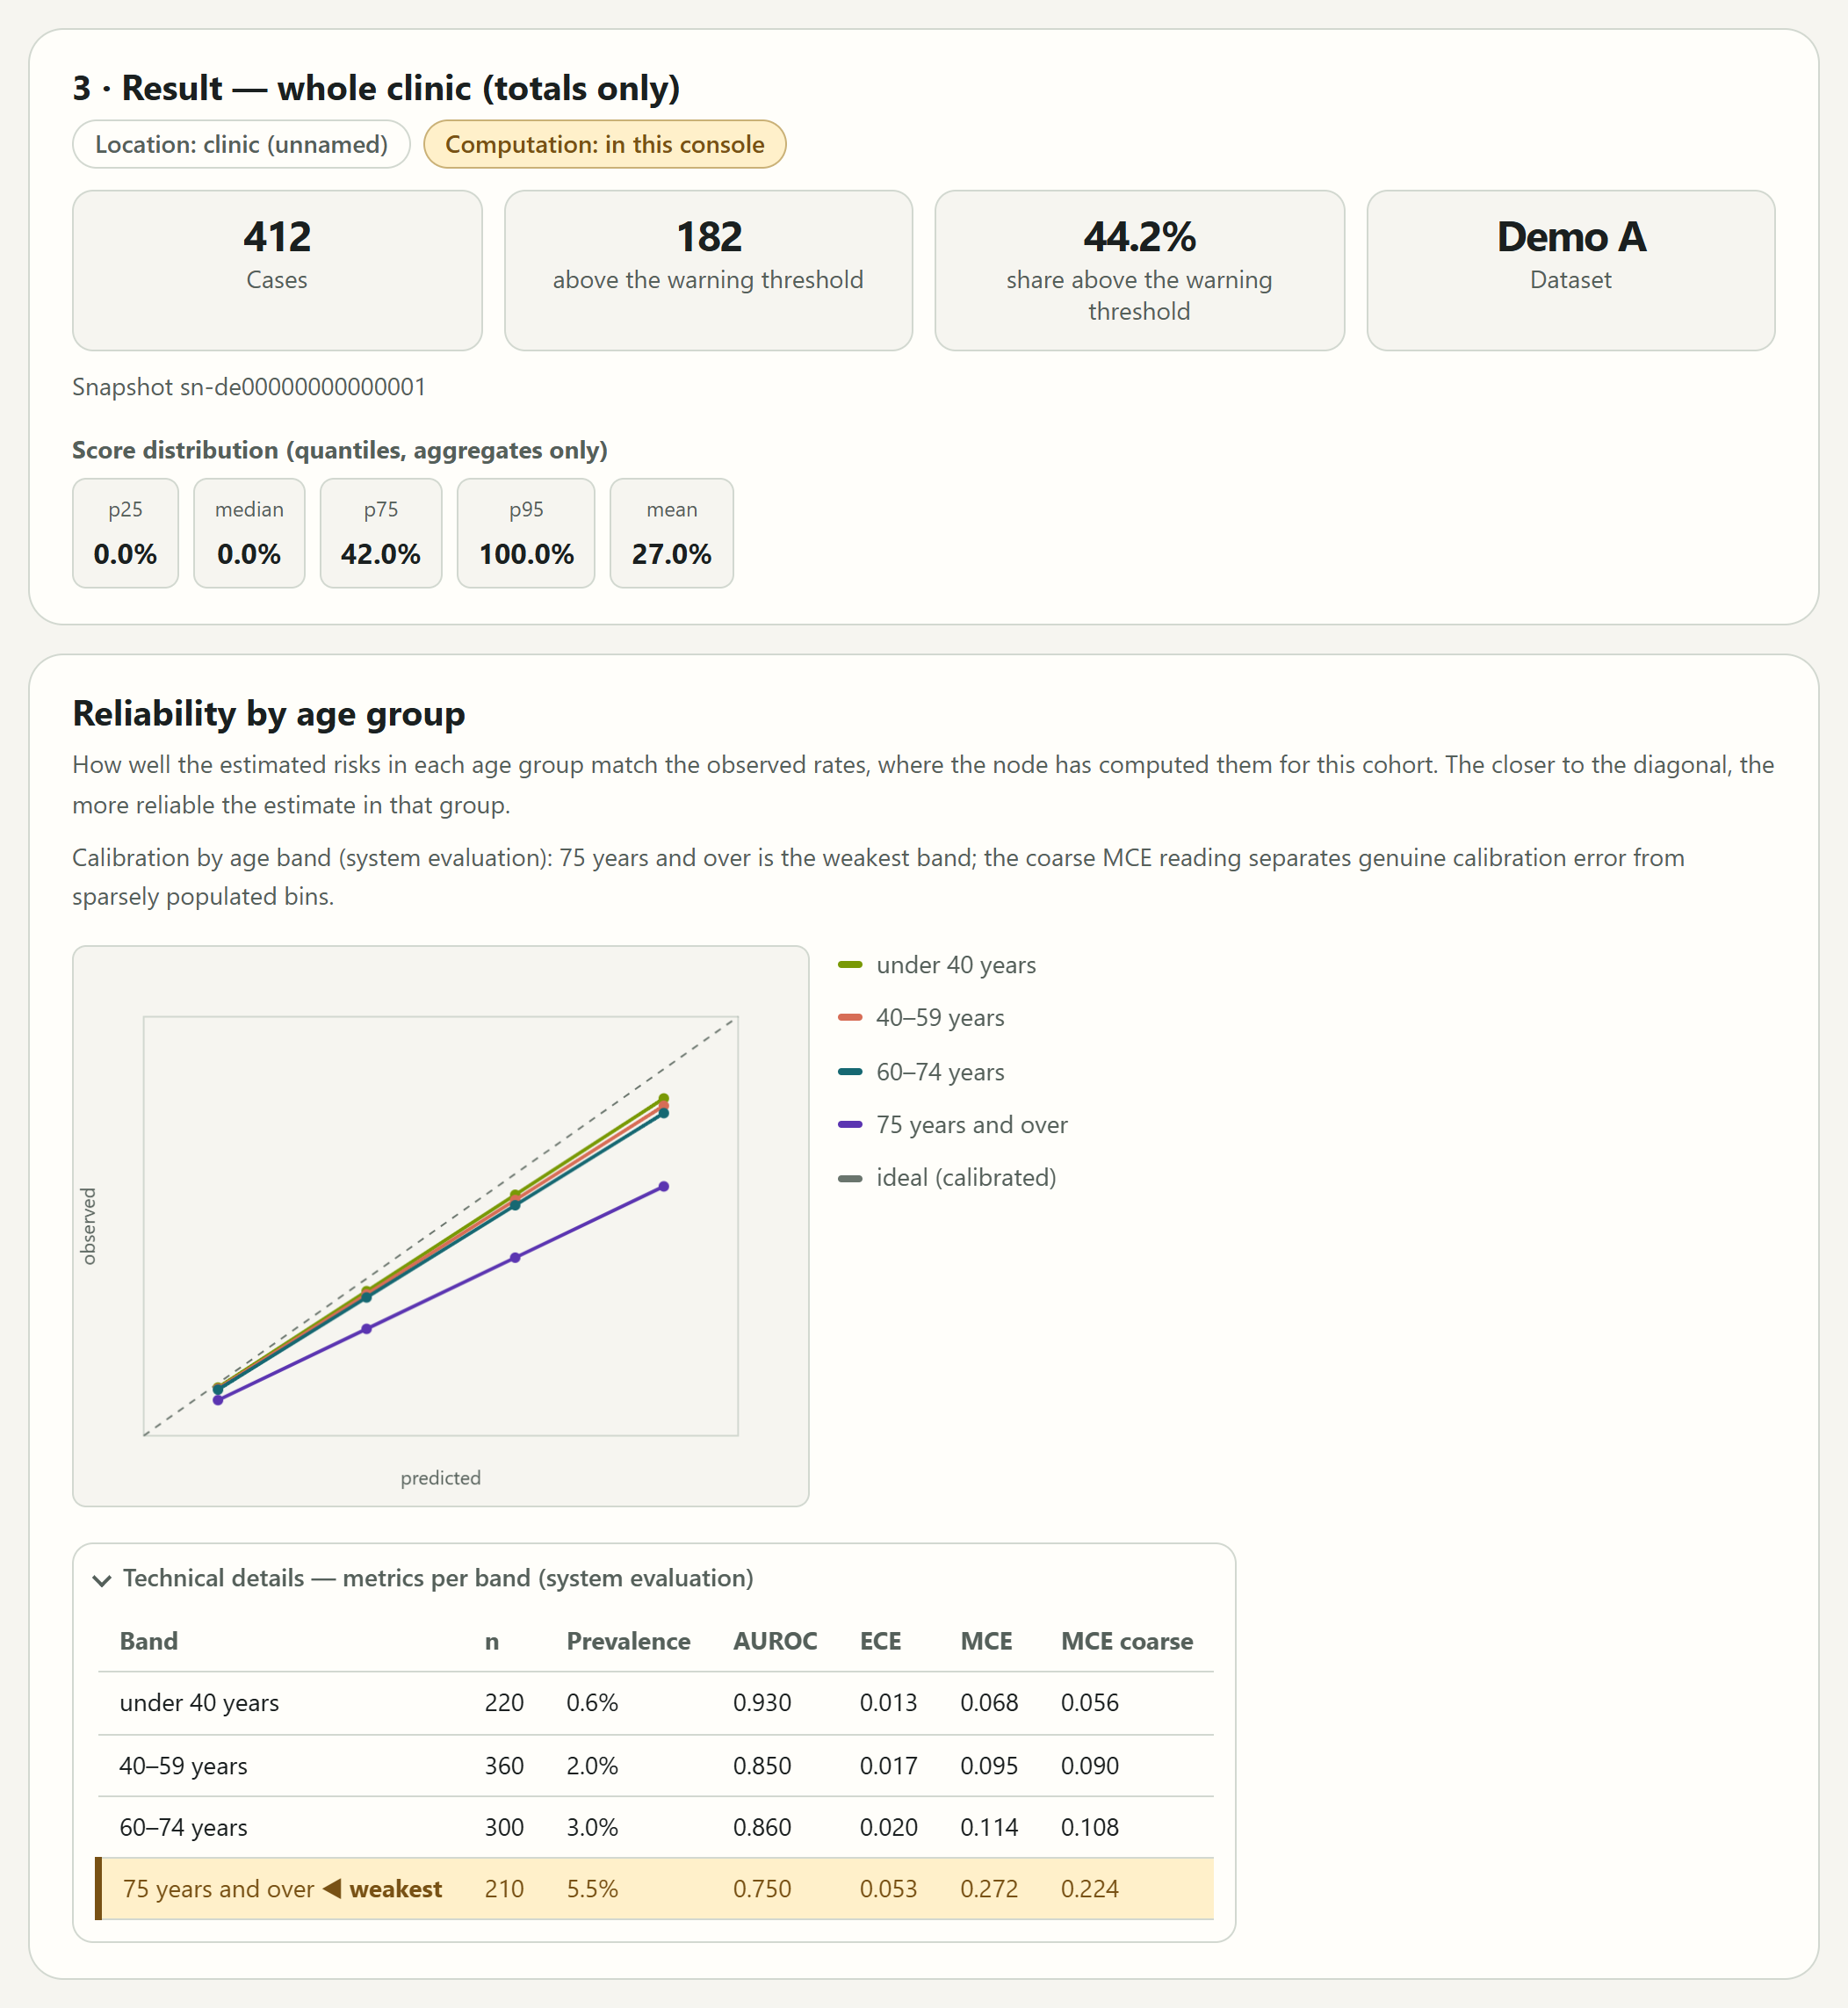
The heading reads ‘3 · Result — whole clinic (totals only)’, followed by the two context statements. Then come:
- four cards: the Cases in the dataset, how many of them are above the warning threshold, the share above the warning threshold, and the Dataset. This view does not state which warning threshold the node used.
- ‘Snapshot …’: the id of the snapshot, that is the recorded state of the dataset that was evaluated. It makes it possible to trace which data lay behind the result.
- Score distribution (quantiles, aggregates only): the estimated risks of all cases as summary values of a distribution. ‘median’ is the value below which half of the cases lie; ‘p25’, ‘p75’ and ‘p95’ are the values below which 25, 75 and 95% lie; ‘mean’ is the average. All values are given in whole percentage points.
If a number is too small to show without revealing individuals, suppressed stands in its place. The same holds for a number whose counterpart is small: if almost every case lies above the warning threshold, that number stays suppressed too, because the few others could otherwise be worked out. If the whole dataset is too small, the node releases nothing, and the interface reports ‘The cohort is too small to report on; nothing is released.’
Reliability by age group
Reliability by age group shows how well the estimated risks in four age groups, under 40, 40–59, 60–74 and 75 years and over, match the observed rates. The closer a curve lies to the diagonal ‘ideal (calibrated)’, the more reliable the estimate in that group.
- When connected, in this version it reads ‘Calibration by age band is not available for this cohort: the node does not provide it.’
- Technical details holds a table per age group with the number of cases (n), the prevalence, that is the share of cases with the event, and AUROC, ECE, MCE and ‘MCE coarse’. The group with the weakest calibration is marked weakest, in the demo the group of 75 years and over.
Below all results, the interface reminds you: ‘Data protection: no patient data leaves the clinic. The assessment of a single case stays in the hospital; for the whole clinic, only totals and distributions are shown — never values of individual patients.’
Measures at a glance
| Measure | Meaning | How to read it |
|---|---|---|
| AUROC | Area under the ROC curve: how well the model separates cases with and without the event | 0.5 chance, 1 perfect; says nothing about calibration |
| AUPRC | Area under the precision-recall curve: how well the model finds rare events | the chance value is the share of cases with the event; higher is better |
| Brier | mean squared difference between estimated risk and outcome | 0 is perfect; smaller is better |
| CI | confidence interval: the range of uncertainty of a value | wide when there are few cases |
| n (train/test) | number of cases for training and testing | – |
| ECE | mean difference between estimated and observed rate across all groups, weighted by the number of cases | 0 is perfectly calibrated |
| MCE | largest difference between estimated and observed rate in any group | sensitive to small groups |
| MCE coarse | MCE over coarser groups | separates genuine calibration error from chance outliers in sparsely populated groups |
| Calibration split | cases the recalibration was fitted on | – |
| Warning threshold, operating point (OP) | estimated risk from which a case is flagged | a trade-off between detection rate and false alarms |
| Detection rate (sensitivity) | share of the patients who actually die who are flagged | higher means fewer missed cases |
| Precision (PPV) | share of flagged cases who actually die | depends strongly on how common the event is |
| Specificity | share of survivors who are correctly not flagged | higher means fewer false alarms |
| FN:FP | weighting used to choose the warning threshold: missed case (FN) against false alarm (FP) | 10:1 means a missed death weighs ten times as much |
| Prevalence | share of cases with the event | – |
| median, p25, p75, p95 | values below which 50, 25, 75 and 95% of cases lie | – |
| SHAP | a feature's contribution to the prediction | aggregated and without direction in training, with direction for a single case |
| Logit | scale of the contributions and the base value (log-odds) | not a percentage |
| Platt / sigmoid, Isotonic | recalibration methods: a smooth curve or a stepwise adjustment | – |
A warning threshold is always a trade-off. A lower threshold detects more of the patients who die, but also flags more cases who survive. Precision also depends on how common the event is in a clinic; the same model can have a different precision there than in the validation.
Messages
Most messages state their reason in words. Many end with a support ID, such as ‘(Support ID: …)’. Note it when you ask the operations team for help.
Connection and services
| Message | Meaning | What you can do |
|---|---|---|
| ‘Server not reachable’ | The interface cannot reach its service. | check the network connection, try again later |
| ‘Service not reachable (HTTP …)’, ‘Service not reachable.’, ‘The service did not answer in time.’ | A service behind it, such as the platform or the node, does not answer. | try again later; if it persists, inform the operations team |
| ‘Server error (HTTP …)’, ‘Server error.’, ‘An error occurred.’ | An unexpected error in the service | contact the operations team with the support ID |
| ‘Unexpected response from the server (field …)’, ‘Unexpected response from a service.’ | A service answered differently from what the interface expects; usually versions do not match. | contact the operations team |
| ‘The request carries no service credential.’, ‘The service credential is not registered.’ and other messages about service credentials | The platform does not accept the credential of the interface or the node. | contact the operations team |
| ‘Not authorised (HTTP …)’, ‘No permission for this action.’ | Access is not permitted. | contact the operations team |
| ‘Does not match the current state (HTTP …)’ | The state has changed in the meantime, for example because a job has already ended. | reload the page |
| ‘The service cannot reach its data right now; nothing was changed. Please try again later.’ | The service temporarily cannot store anything. | try again later |
Training
During a training run, notes can appear in the Progress log: ‘Status request failed: …’ or ‘Live connection disrupted’ mean that a request did not get through; the interface keeps trying. ‘Too late to cancel (the job has already finished)’ means that the job was already done. ‘Backend unreachable’ and ‘The backend refused access (check the BFF's service credential)’ concern the connection to the platform and are a matter for the operations team.
If a training run fails, the interface gives one of these reasons under Training failed:
| Reason | Meaning |
|---|---|
| ‘The data model version does not match: …’ | The job requires a Schema version that the node or the snapshot does not have. Choose a matching version. |
| The job names the hospital's own data. | The node trains on the hospital's own data only when the job is approved for it. |
| ‘The job contains a value the node does not accept.’ | The node does not support one of the settings. |
| ‘The job asks for training code other than the node's installed code.’ | The platform and the node run different versions; a matter for the operations team. |
| ‘The node did not release the job's dataset.’ | The node does not release the data the job asks for. |
| ‘The node's output guard withheld the result; none of it left the node.’ | The check at the node that lets out only harmless metrics withheld the result, for example because it might reveal individuals. |
| ‘The centre's output guard refused the reported result; it was not stored.’ | The same check on the platform's side |
| ‘The training run broke its sandbox's limits and was stopped.’, ‘The training run read data outside its snapshot and was stopped.’ | A safeguard at the node ended the training. |
| ‘The node's trainer could not run the job.’, ‘An operational fault at the node stopped the job.’, ‘The job failed unexpectedly at the node; the details are in the node's local log.’ | An error at the node; the site's operations team finds the details in its log. |
| ‘The job failed for a reason this version does not know.’ | The node reports a reason this version of the interface cannot translate. |
If the result cannot be loaded, it reads ‘Result not available: …’; New training run starts over.
Assessing risk
| Message | Meaning |
|---|---|
| ‘Inference failed: …’, ‘The node could not score the encounter.’ | The calculation for the single case failed. |
| ‘The clinic's node names no model to calculate with; nothing is calculated until it does. Please reload later.’ | The node has no model loaded; both calculate buttons are locked. Reload the page later. |
| ‘The model at the clinic's node has changed since this form was opened; nothing was computed. Reload and compute again.’ | Since the page was opened, the node computes with a different model. Reload the page and calculate again. |
| ‘The node's model cannot be loaded right now.’ | The node temporarily cannot use its model; try again later. |
| ‘Cohort inference failed: …’, ‘The node could not score the cohort.’ | The evaluation of the whole clinic failed. |
| ‘The cohort is too small to report on; nothing is released.’ | The dataset has too few cases to show totals without revealing individuals. |
| ‘The node's output guard withheld the result.’ | The check at the node did not let the result out. |
| ‘The output guard is unavailable; nothing is released.’ | Without this check, the node releases nothing. |
| ‘The node's datasets could not be loaded: …’, ‘The node's dataset catalogue is not available.’ | The list of datasets cannot be reached. |
| ‘The node's catalogue has no such dataset.’, ‘The dataset has been withdrawn from the node's catalogue.’ | The chosen dataset is no longer available; reload the page. |
| ‘The dataset has not been approved yet.’, ‘The dataset is not released for this purpose.’, ‘The node's catalogue does not allow this dataset here.’ | The dataset may not be used for this evaluation. |
| ‘The dataset changed since it was catalogued; it is not used until it is checked again.’ | The dataset must be checked again at the node. |
The messages about implausible input are explained in the section Input that is not computed.
Demo and connected operation
The computation statement in the header shows whether an interface runs as a demo: in the demo it reads Computation: in this console. The demo needs neither the platform nor a node.
| Area | Demo | Connected |
|---|---|---|
| Training | runs for about six seconds at the demo node demo-klinik-1 | runs at a clinic node; numbers that are too small are suppressed |
| Location in Assess risk | Location: clinic (unnamed) | the clinic's name |
| Result for a single case | computed with the demo model | computed with the model the node has loaded, with its warning threshold and metrics |
| Whole clinic | datasets ‘Demo A’ to ‘Demo C’; never suppressed | the node's datasets; small numbers are suppressed |
| Reliability by age group | shown | not available |
| Provenance line | without a time | with ‘Calculated on …’ |
When connected, Assess risk always computes with the model the node has loaded. In this version, the model list, input fields, example profiles and warning threshold in step 1 still come from the demo, and the interface says so: ‘Placeholders from the demo: the model list, input fields, example profiles and warning threshold describe a demo model, not the model the node has loaded. The node scores with its own model: it ignores inputs that model does not know and replaces missing ones with normal values.’ For reading results, this means:
- The choice under Choose a model is not passed to the node. Which model computed the result is shown in the result's provenance line, and it can differ from the choice.
- The Warning threshold box in step 1 shows the demo model's values; the cards in the result show the node's. If the node supplies no validation values for its threshold, cards can show ‘0.0%’; that is then not a measured value.
- Values the node filled in are marked ‘~ normal value assumed’ among the contributing factors.
When connected, the copied text contains the same note.
Language, display and accessibility
Language. The button at the top right switches between German and English; it carries the other language's name in that language. The interface remembers your choice on this workstation. Without a choice, it follows the first German or English language in your browser's settings, otherwise English. Switching changes everything, including messages already shown, the copied text and the way numbers are written, such as ‘1,6’ and ‘1.6’.
Display. The interface follows your operating system's light or dark mode; it has no switch of its own. Charts adapt when the mode changes. Printouts are always light. Below a width of about 1100 pixels, the interface arranges everything in one column.
Keyboard. Pressing the Tab key first shows Skip to content, which skips the header. You move between Single case and Whole clinic with the arrow keys; Home and End jump to the first and last tab. After Cancel training, the focus moves to the job's heading.
Screen readers. The status, the progress and the result line are announced when they change. Charts have a description in words, and every row of the contributing factors states its direction. Fields with errors are marked as invalid and connected to their note.
Colour. No information depends on colour alone: signs, the words ↓ low and ↑ high and additions such as ‘(done)’ say the same in words. In the operating system's contrast modes these marks remain. On touch devices the buttons are larger.
Operating the platform
- Restrict access to both interfaces through the institution's network.
- When connected, check the result's provenance line to see which model computed it (see Demo and connected operation).
Patient data does not leave the clinic. A training run returns only aggregated metrics and a model without personal data. The assessment of a single case stays in the hospital, and for the whole clinic the interface shows only totals and distributions.
Help and feedback
For questions about using the interfaces and for errors, contact your site's contact person in the project. Say which interface you used, what you did, the exact wording of the message and, if there is one, the support ID.
Feedback on this guide is welcome at Bitspark GmbH; the contact details are in the legal notice. The guide is published as a page on the website and as a PDF, both with the same content.